
Mapping California's Politically Vulnerable Communities
Static Election maps - Hot spots
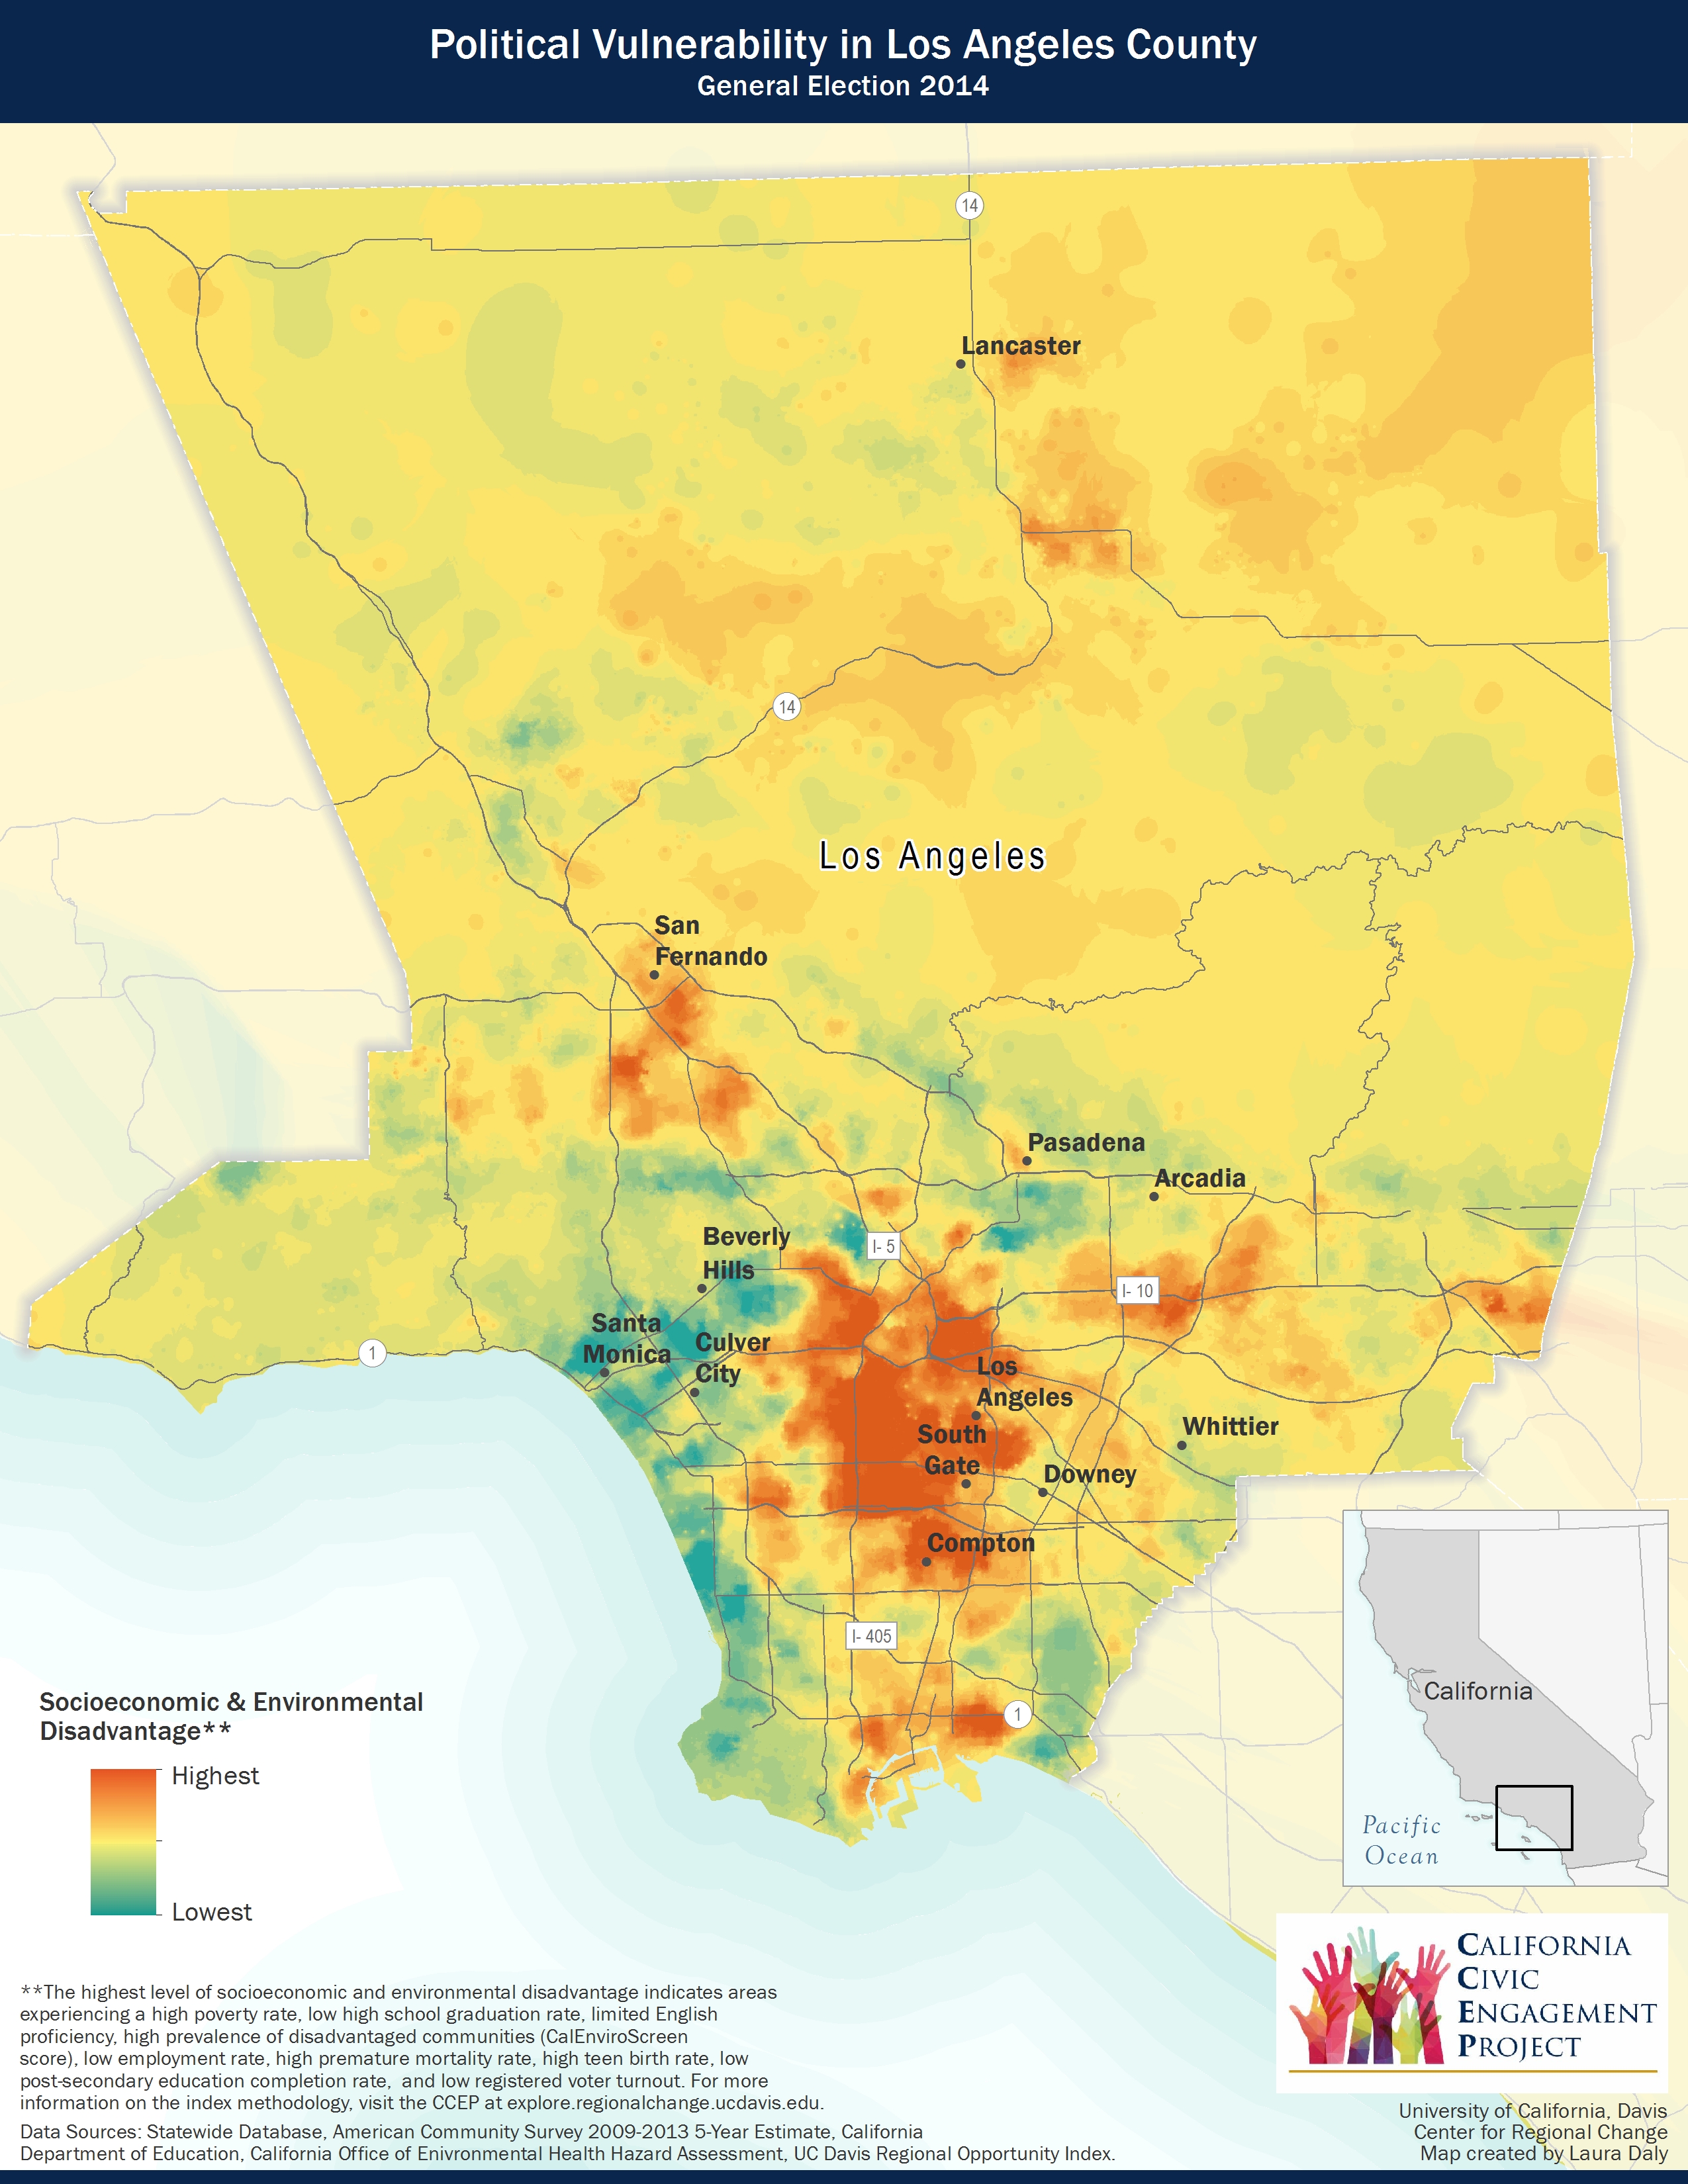
These static maps identify ‘hot spots’ of Politically Vulnerable Communities, which are defined by CID as low-turnout communities where residents face multiple disadvantages in terms of economic, educational and health outcomes (based on CID’s calculated Index of Political Vulnerability).
The 'hot spot' static maps offer a statewide geographic view of turnout and cover six key regions: the San Francisco Bay Area, Sacramento, San Joaquin Valley and the greater Los Angeles, urban Los Angeles and San Diego areas
CID’s Index of Political Vulnerability is calculated with educational, economic, and health measures commonly associated with disadvantaged communities and low voter turnout. CID’s Hot Spot Maps provide a clear picture of how and where Political Vulnerability is greatest in the Golden State. For more information on the methodology used in this mapping research, click here.
See the Mapping California's Politically Vulnerable Communities project page for interactive 2012 and 2014 general election maps.