

Mapping California's Politically Vulnerable Communities
Static GIS ELECTION Maps
CID has created a series of Static GIS Maps visualizing the relationship between low voter turnout (including maps of total, Latino, Asian-American and youth turnout) in California communities and economic, educational and health outcomes. These include:
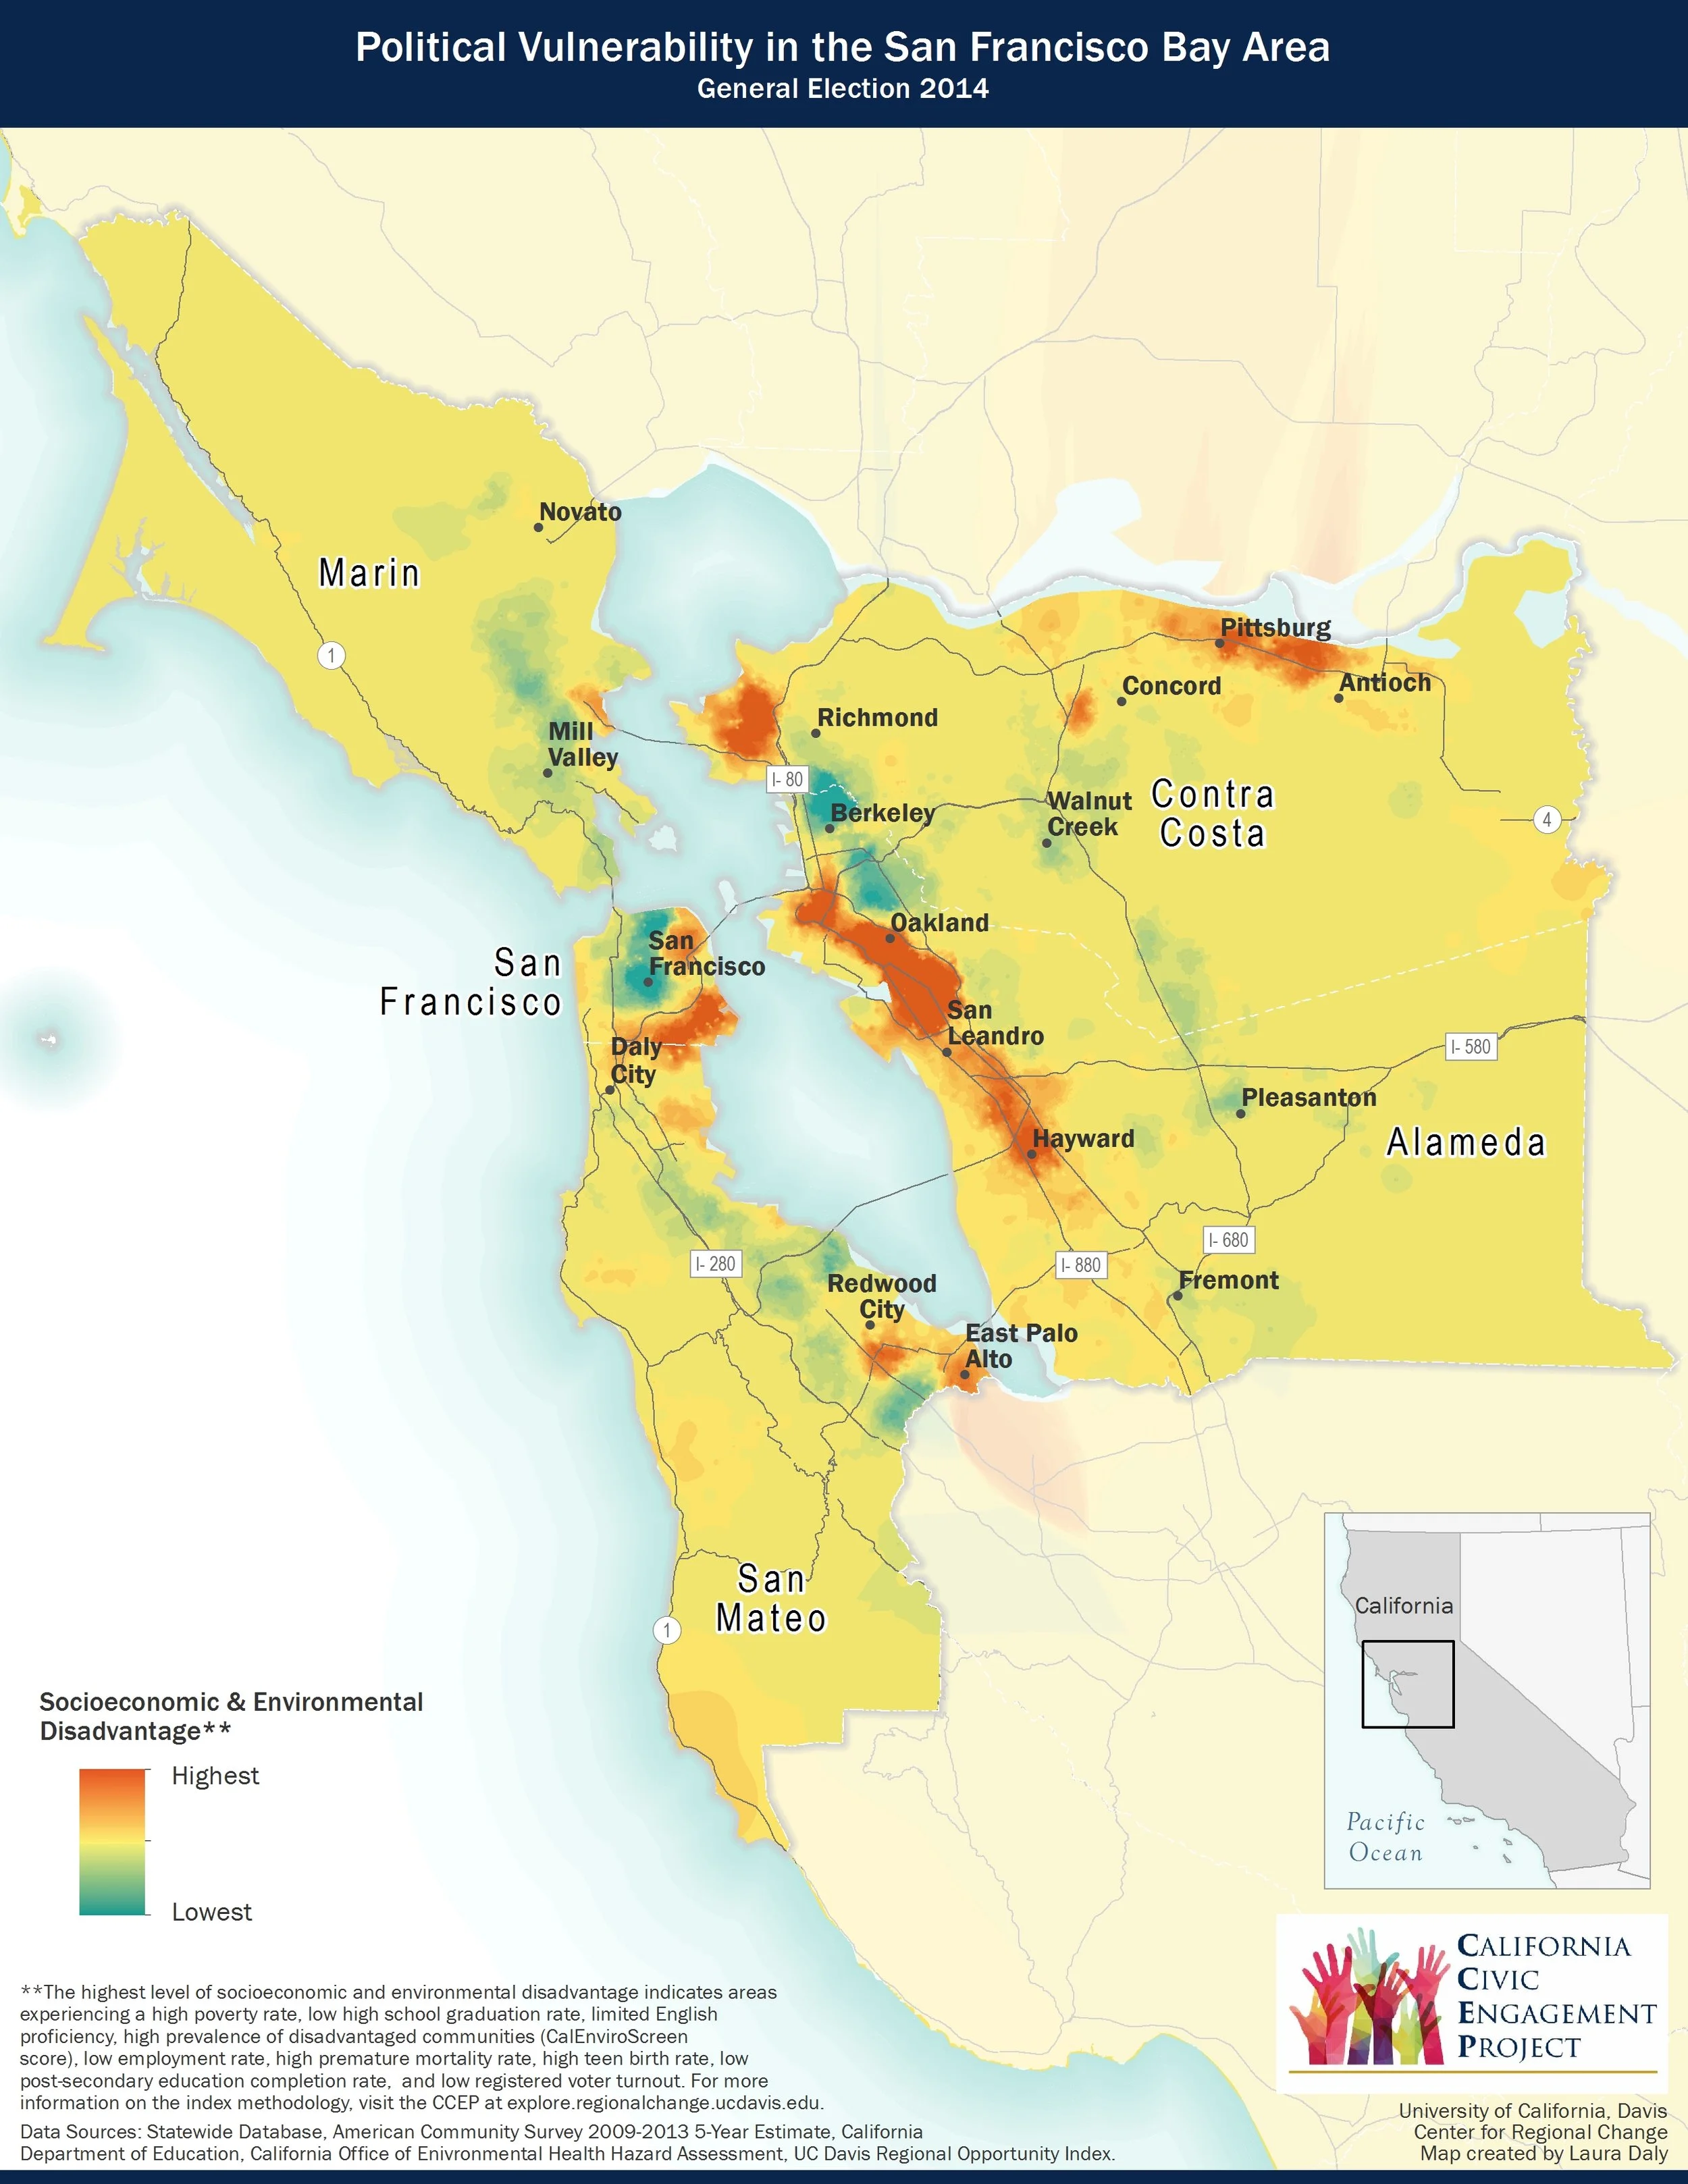
Hot Spot Maps: These maps identify ‘hot spots’ of Politically Vulnerable Communities, which are defined by CID as low registered turnout communities where residents face multiple disadvantages in terms of economic, educational and health outcomes (based on CID’s calculated Index of Political Vulnerability).*
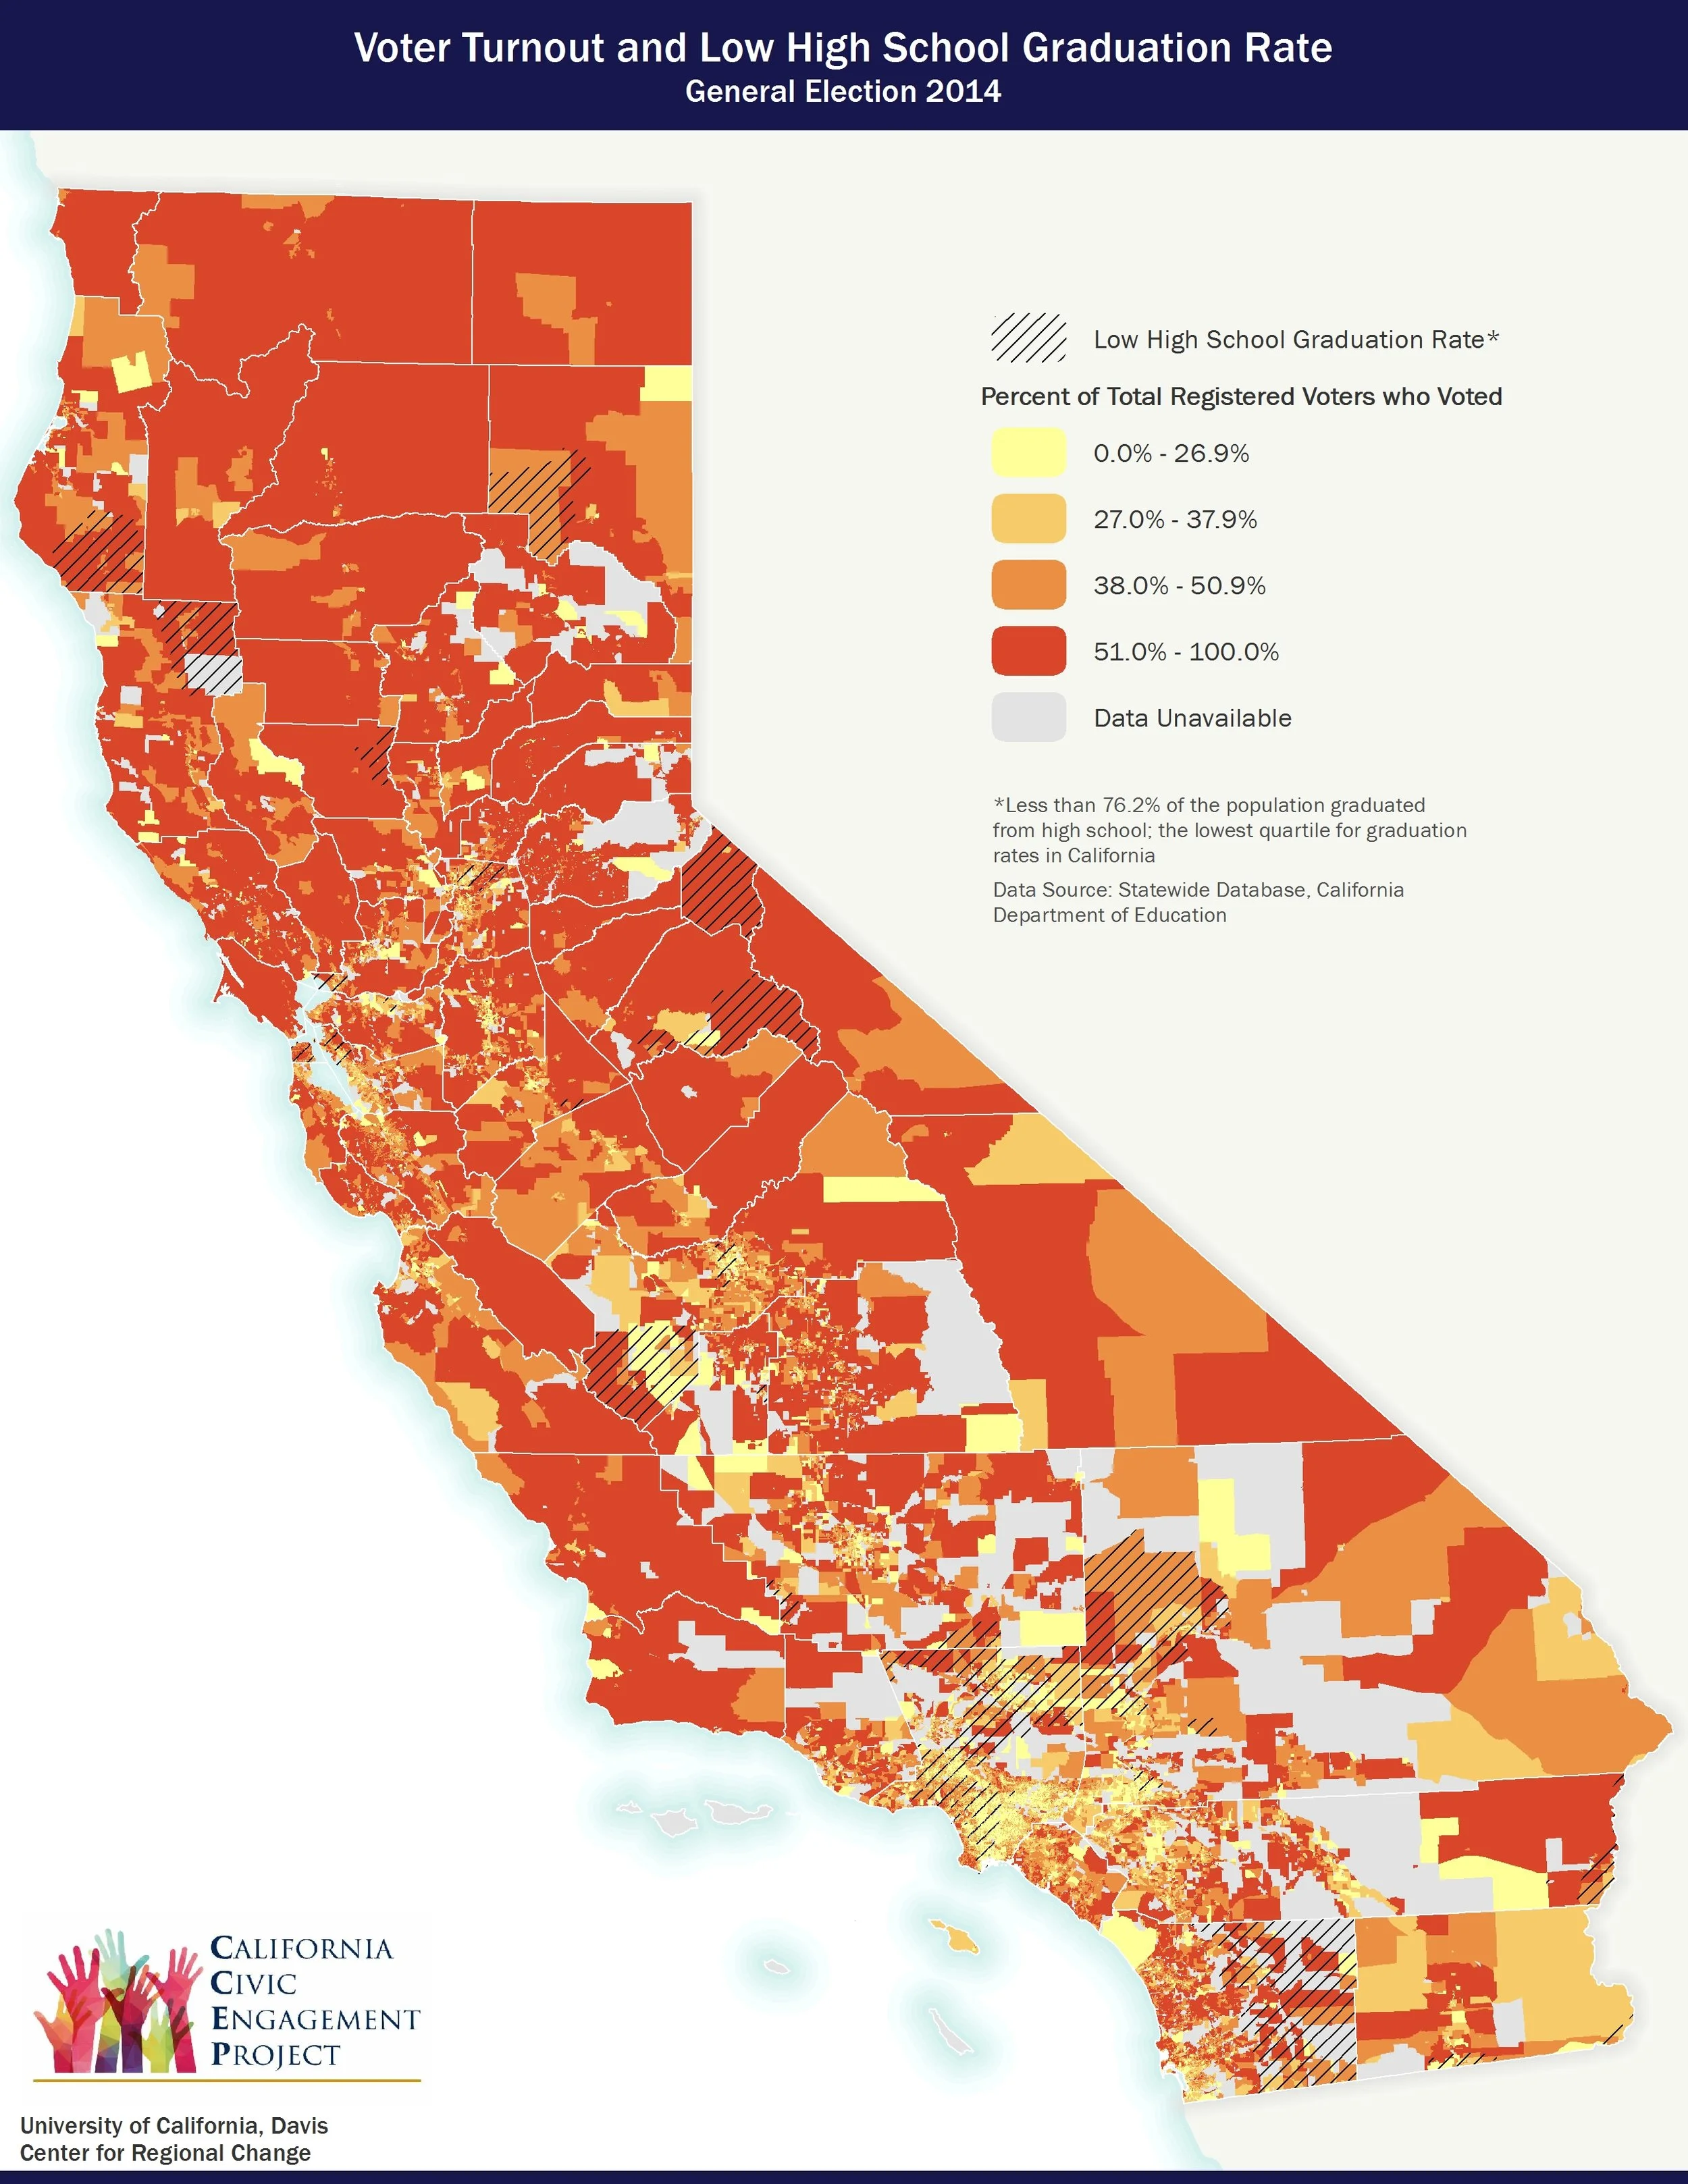
Two-layer Maps: These maps show registered voter turnout overlaid with individual economic, educational and health outcome data. Factors examined include education (low high-school graduation rates, a lack of post-secondary education), economic factors (poverty, high unemployment rate, not having access to a vehicle), health (poor environmental health, high teen birth rates, premature mortality) and civic access (limited English proficiency, percent of eligible voters).
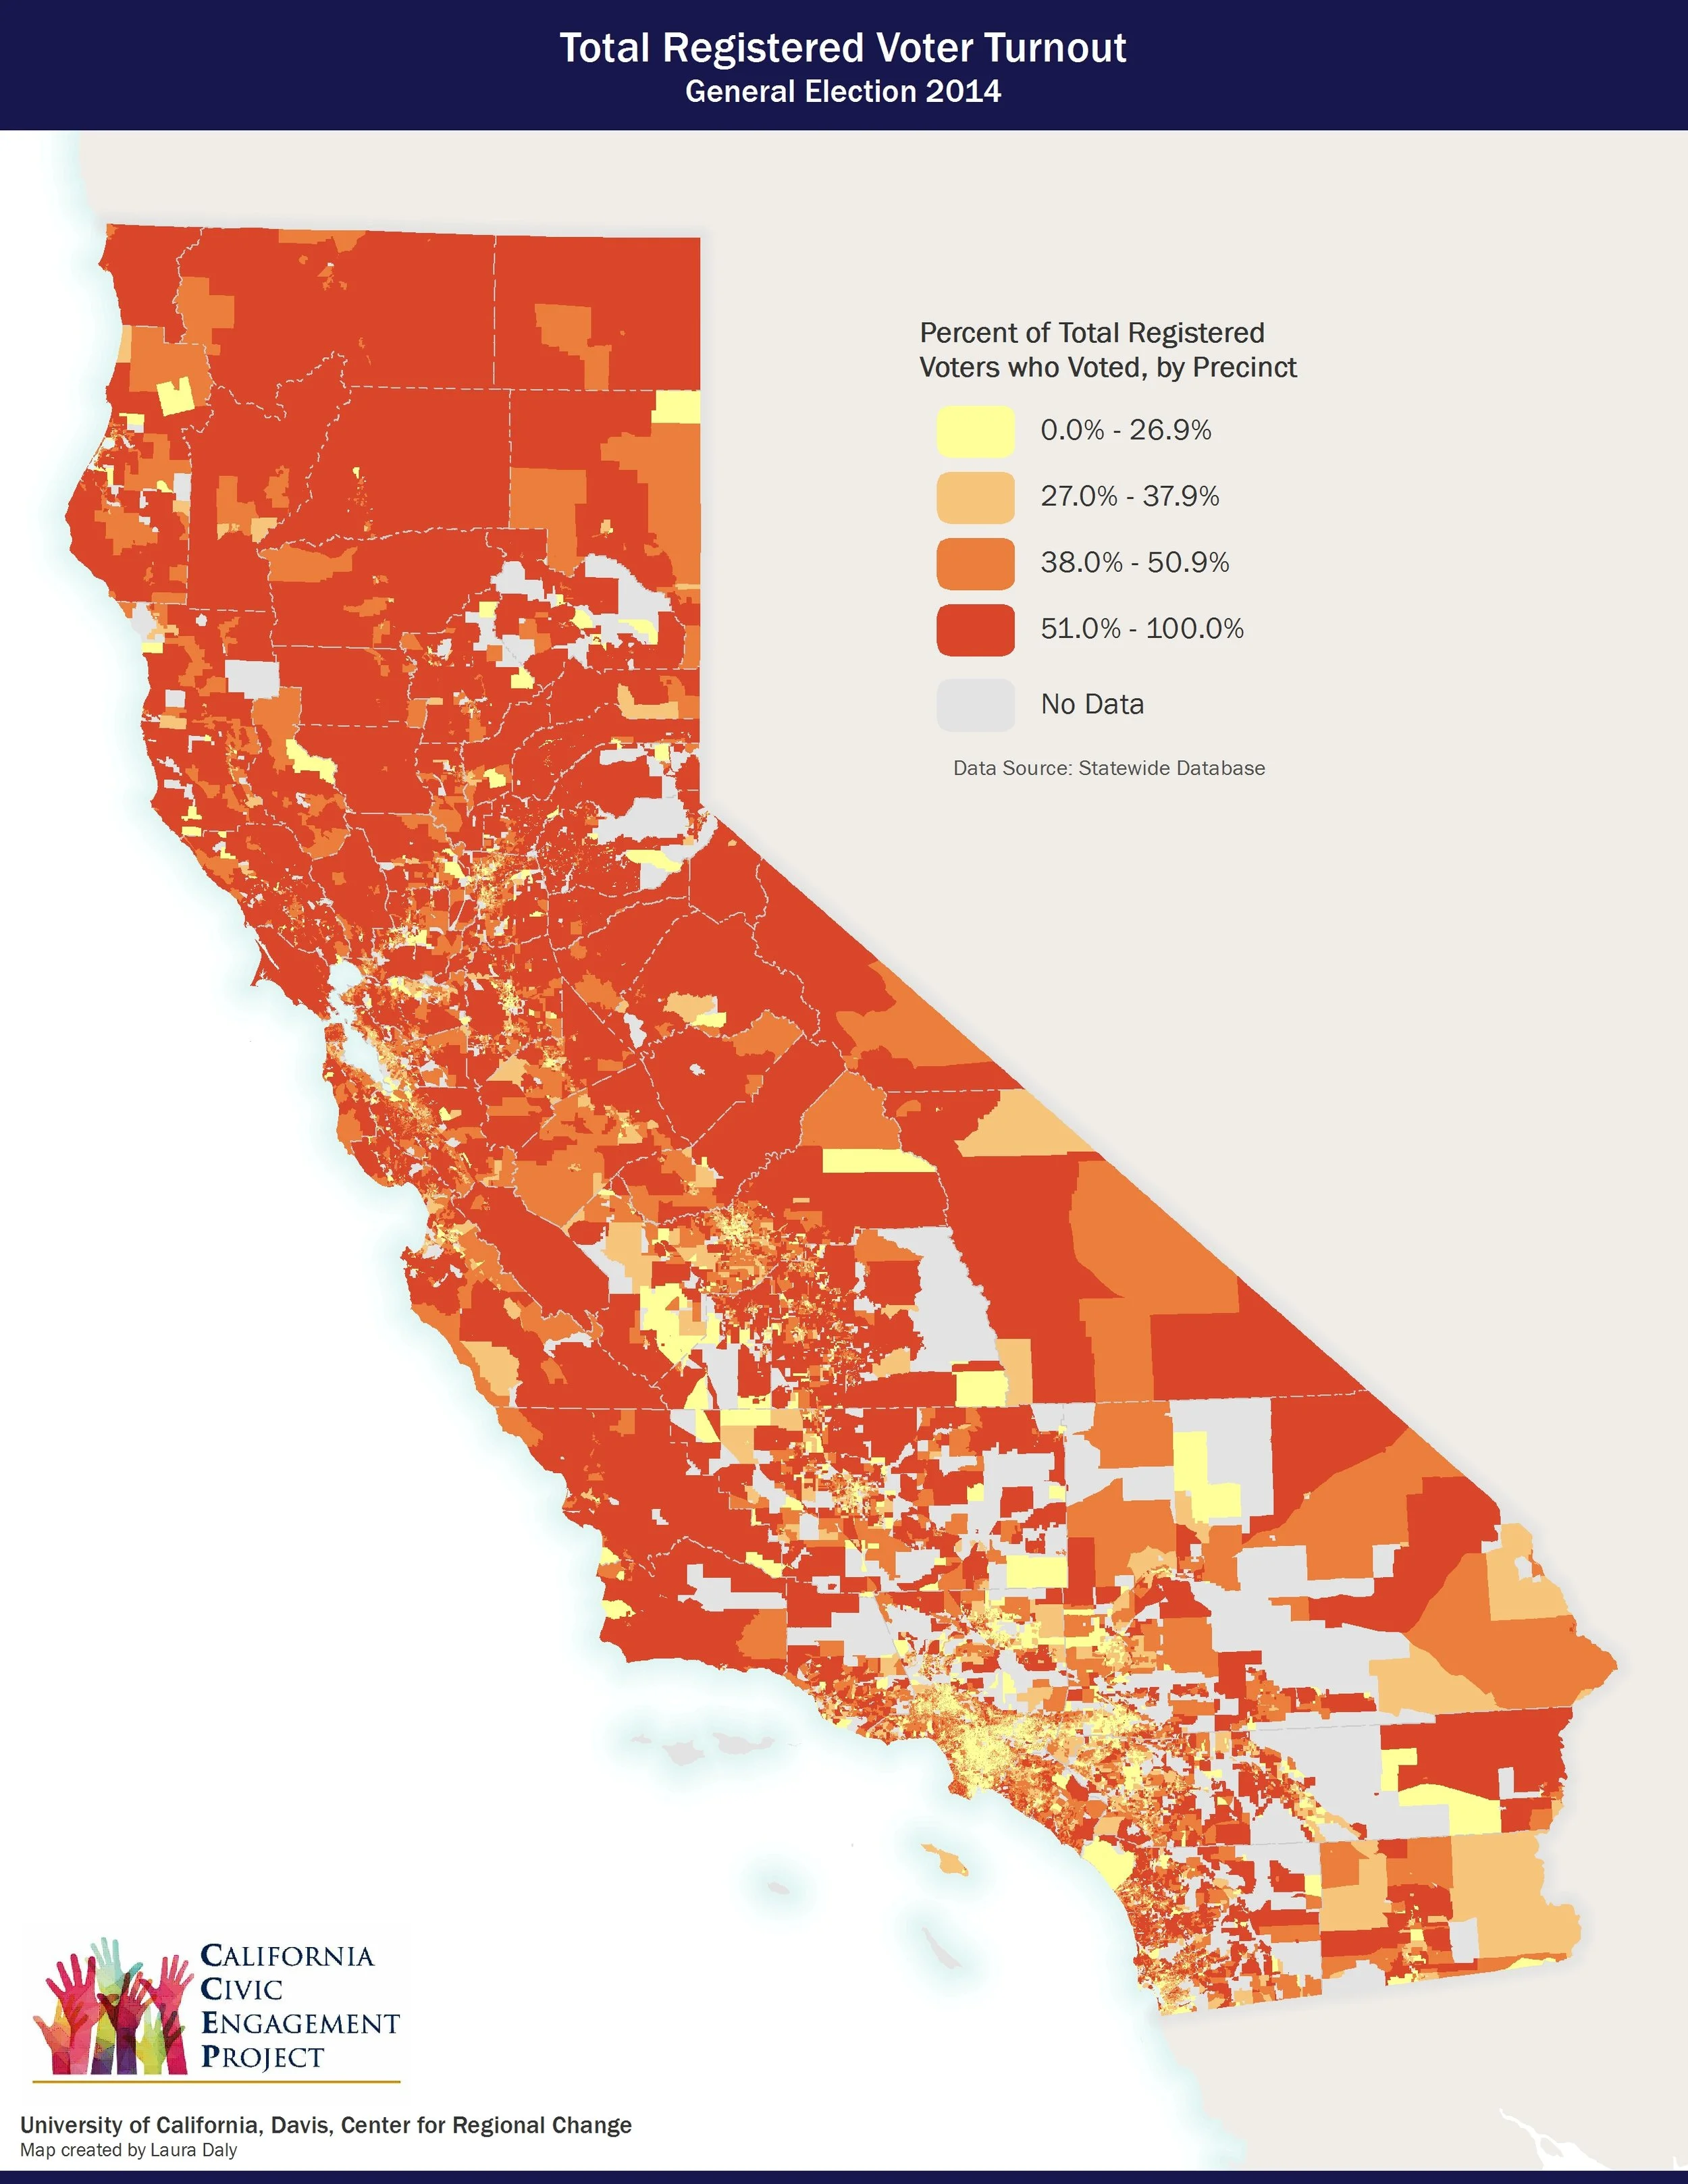
Registered-Voter Turnout Maps (one-layer maps): These maps present the registered voter turnout of Latinos, Asian-Americans and youth, and of the total population in California. Detailed static maps offer a statewide geographic view, and cover five key regions: the San Francisco Bay Area, the San Joaquin Valley and the greater Los Angeles, Sacramento, and San Diego areas.
*CID’s Index of Political Vulnerability is calculated with educational, economic, and health measures commonly associated with disadvantaged communities and low voter turnout. CID’s Hot Spot Maps provide a clear picture of how and where Political Vulnerability is greatest in the Golden State. For more information on the methodology used in this mapping research, click here.
See the Mapping California's Politically Vulnerable Communities project overview page for more information.